Fora do Digital
An open, interactive dashboard on internet access in Brazil. It uses official data from the PNAD Contínua TIC (the ICT module of the Continuous National Household Sample Survey), run by IBGE (the Brazilian Institute of Geography and Statistics), from the 2024 and 2025 reports. The central question: who is still offline, and what does that mean for people who design 100% digital customer service?
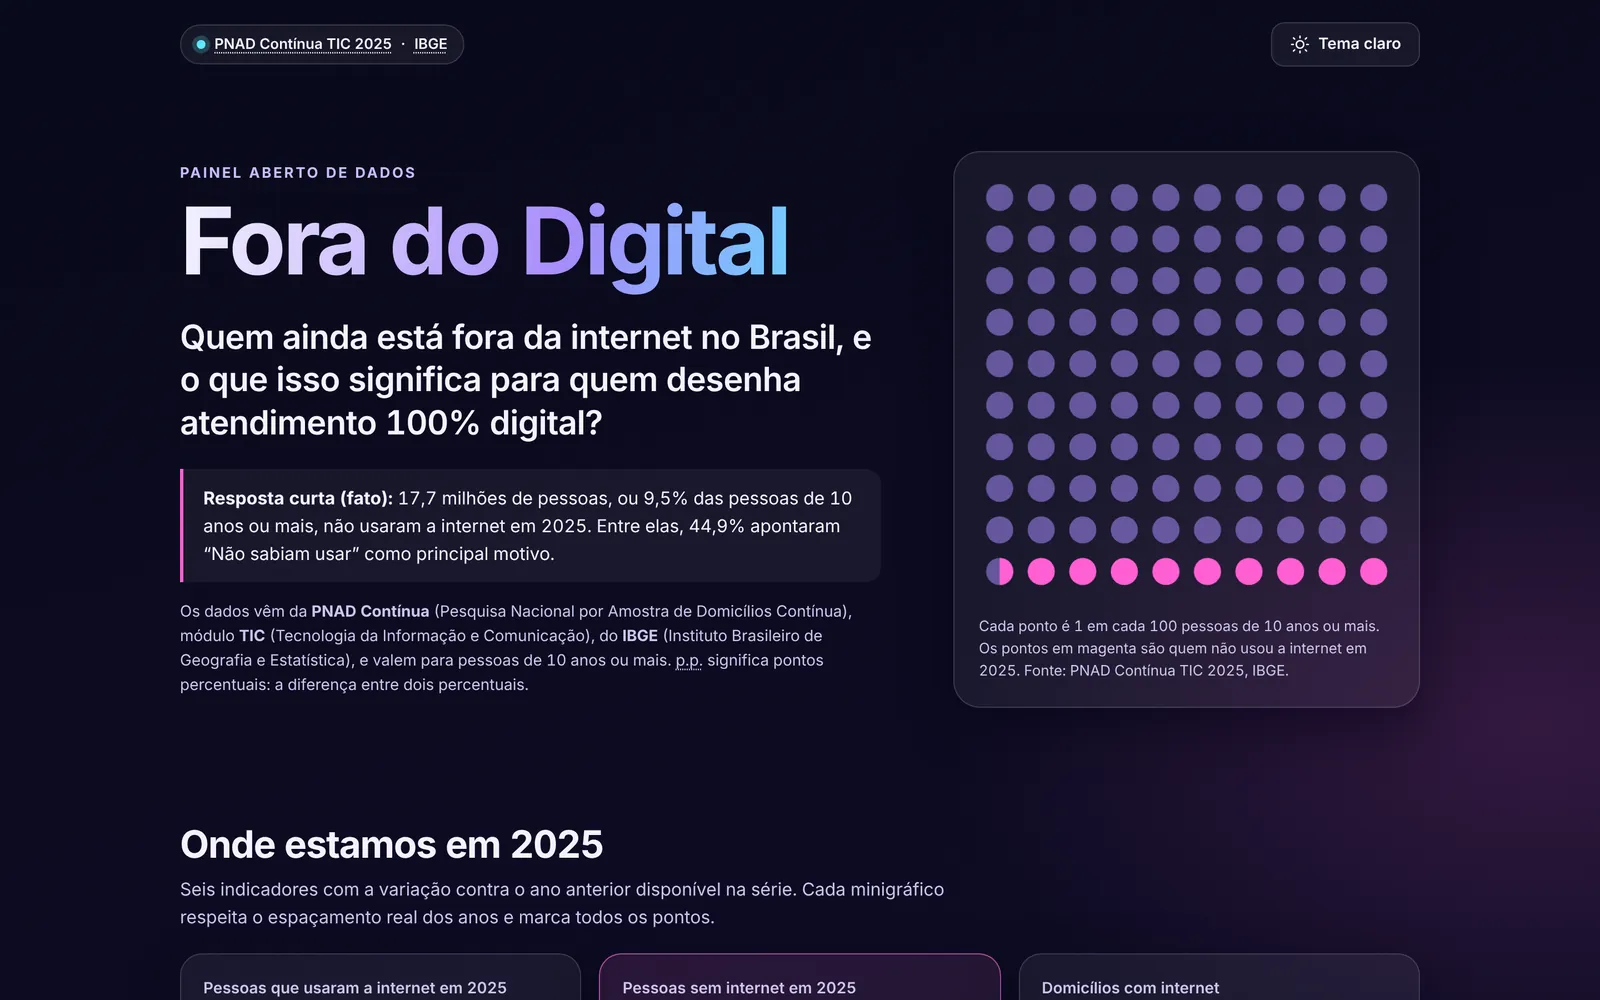
On small screens the dashboard is not embedded here. Open the full version in a new tab.
View dashboard- Purpose
- Open, interactive dashboard on internet access in Brazil
- Technologies
- Data
- IBGE PNAD Contínua TIC, 2024 and 2025 reports
- Status
- Published on GitHub Pages
- License
- MIT. The data belongs to IBGE.
The problem
People who design customer service often decide which channels exist and which ones go offline. That kind of decision tends to rely on the average of those who are already connected.
The dashboard asks: who is still offline in Brazil, and what does that mean for people who design 100% digital customer service?
I work with customer service and the ombudsman function. The dashboard brings both sides together: well-handled public data and a question that anyone who serves people needs to answer before making a channel 100% digital.
What the dashboard shows
- Headline indicators with trends: people who used the internet, people without internet (in millions and as a percentage), households with internet, people with a mobile phone for personal use and people aged 60 or over who are online.
- How internet use has changed in urban and rural areas.
- 2025 breakdowns by region, area, age, education, sex and color or race, one at a time.
- Reasons for not using the internet, for people and for households, and reasons for not having a mobile phone.
- What the internet is used for and which devices are used to get online.
- A highlight with the real average monthly per capita income of households with and without internet. Income appears only in that highlight, not as a breakdown.
- A "Sua base de clientes" (your customer base) simulator, an alternative table for every chart and a CSV download of the data.
Data source
The data is official and comes from the PNAD Contínua (the Continuous National Household Sample Survey), the IBGE (Brazilian Institute of Geography and Statistics) survey that measures internet access. The dashboard uses the ICT (Information and Communication Technology) module, from the 2024 and 2025 reports.
The figures were transcribed from the reports into a data file, and every series, breakdown and block points to the source it came from. The data belongs to IBGE.
The project uses only IBGE publications as sources.
How it was built
Data
The data lives in a JSON file, with the source of each series.
Python
A Python script, using only the standard library, validates the data, calculates the derived values and generates the file the page reads.
Page
The page is plain HTML, CSS and JavaScript. The charts are custom SVG, with no charting library, no framework and no CDN.
Use
It works offline: you can open the page by double-clicking the file, with no server and no installation. The published version is on GitHub Pages.
Technical decisions
Plain JavaScript, no framework and no CDN
The dashboard has few screens and no dependencies to maintain. It works offline and will keep working years from now.
Data file generated from the JSON
Browsers block fetch on local files, so the data is loaded through a script tag and the page opens with a double click. The JSON remains the source of truth, and the automated validation blocks an outdated generated file.
Hand-drawn SVG charts
The axis respects the real spacing between years, series with missing years have dashed segments and null values become gaps. Focus, tooltips and keyboard use are also handled.
Calculations in Python, reading in JavaScript
Changes, differences and the percentages of people who are offline are calculated and tested in Python. The browser only displays them.
Dark theme by default
The theme preference is saved in the browser, with error handling for when storage is blocked.
How the data is validated
Every series, breakdown and block in the data file needs a source that exists in the list of sources. After that, the project follows four steps.
Generate
The gerar_dados.py script validates the JSON, calculates the derived values and generates the file the dashboard reads.
Validate
The validar_dados.py script applies the data quality rules.
Test
Automated tests, written with unittest, cover the validator and the generator.
Repeat in CI
Continuous validation, run with GitHub Actions (the GitHub service that runs automated checks), repeats these steps and uses the --check option to confirm the generated file is up to date.
Limitations: the PNAD Contínua is a sample survey, so the percentages have a margin of error. IBGE revises the series with each release: the 2016 points (urban and rural) and the 2023 points come from the 2024 report and may differ from the revised series. Years without data are not interpolated. Breakdowns are shown one at a time, because profiles cannot be combined without the microdata. The readings for customer service are recommendations from the project, not survey results.
Links
- Published dashboardThe dashboard is in Portuguese
- Code on GitHub
- MethodologyHow each figure was obtained and calculated, in Portuguese
- IBGE, PNAD Contínua, 2025 report (PDF, in Portuguese)
- IBGE, PNAD Contínua, 2024 report (PDF, in Portuguese)
MIT license. The data belongs to IBGE.