Ouvidômetro
An interactive dashboard on deadlines and delays in ombudsman requests filed on Fala.BR, the Brazilian federal government’s ombudsman platform, built with open data from the Office of the Comptroller General (CGU). It measures how public bodies respond to citizens: how long they take, how much goes past the deadline and where pending requests pile up.
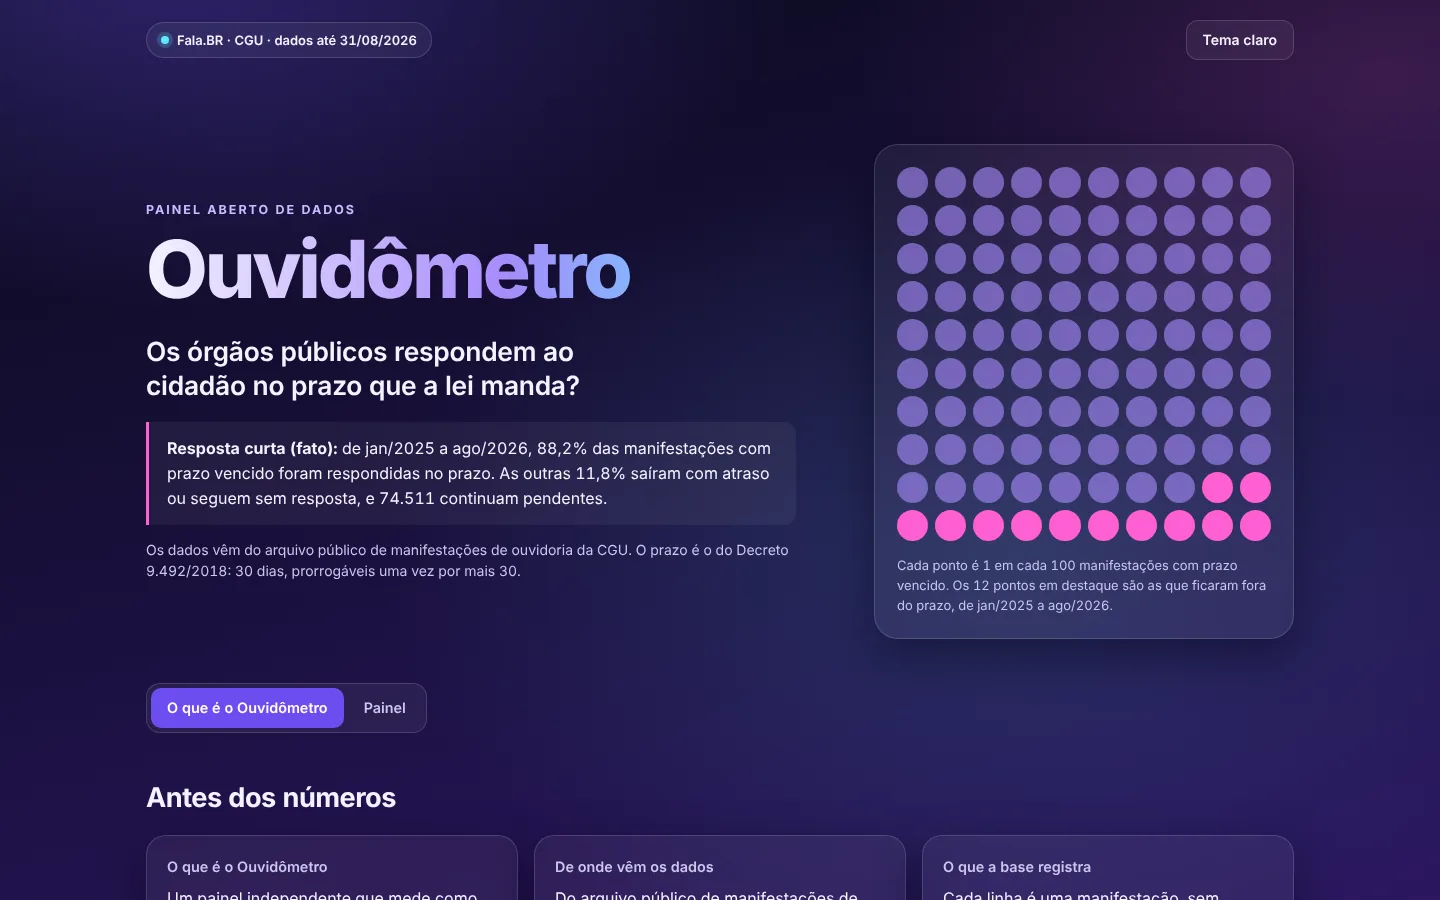
On small screens the dashboard is not embedded here. Open the full version in a new tab.
View dashboard- Purpose
- Interactive dashboard on response deadlines in public ombudsman offices
- Technologies
- Data
- CGU public file of ombudsman requests, from January 2015 to August 2026
- Status
- Published on GitHub Pages
The problem
The dashboard measures how public bodies respond to requests from citizens. The underlying question is the one a public ombudsman manager asks: where to act first.
- Is the legal deadline met, and has that improved?
- How long does the citizen wait for a response?
- What is pending past the deadline?
- In which sphere of government, request type, state and subject is the deadline missed most?
- Which bodies need attention first?
- Was the request resolved, and does the delay weigh on satisfaction?
Legal basis
The dashboard checks the data against Brazil’s public-sector ombudsman rules.
- Decree 9,492/2018, article 18: a conclusive response within 30 days, extendable once for another 30, with justification. A request for more information suspends the deadline.
- Decree 9,492/2018, article 3: definitions of complaint, report, compliment, suggestion and request.
- Decree 9,492/2018, article 16: mandatory use of e-Ouv (now Fala.BR) by federal bodies.
- Law 13,460/2017: rights of users of public services and yearly measurement of satisfaction.
The dashboard itself has a table linking each rule to the indicator that checks it, and a frequently asked questions section.
Data source
The data comes from CGU’s public file of ombudsman requests, updated every month. The file used was generated on September 1, 2026 and has one CSV per year, with filing, deadline and response dates, type, body, subject, status, sphere of government and satisfaction survey.
The dataset runs from January 2015 to August 31, 2026, with 8,752,496 requests. The dashboard’s main window is the last 12 full months, compared with the previous 12.
The raw data does not go into the repository, only the aggregated indicators.
How it was built
Prepare
A Python script downloads the CGU file, converts the CSVs from Latin-1 to UTF-8 and writes one Parquet file per year.
Aggregate
Another script aggregates the data with DuckDB by month, sphere, type, state, body and subject and writes the data file that feeds the dashboard filters.
Summarize
A third script writes the summary of the last 12 months to JSON and CSV, for anyone who wants the figures outside the dashboard.
Dashboard
The dashboard is built with HTML, CSS and JavaScript, with D3 charts. It has filters for period, sphere, type and state, click-to-filter bars and a search for bodies, and it works offline.
How the dashboard was designed
One question per section
Each section answers a decision question instead of only showing numbers.
Alert color
Color tells you where to look first: green below the average, yellow up to twice the average and red above that.
Median and 90th percentile
The median shows the typical case, and the 90th percentile shows who waits too long.
Pending requests with age
The dashboard shows how long each pending request has been overdue, not just the count.
Denominator in view
Every proportion shows its denominator, and the cutoff date stays visible.
Ranking by rate
Bodies are ranked by rate, with a minimum volume, so that those receiving more requests are not penalized.
Limitations
- The file’s days-overdue field is only filled in for requests without a response. That is why the delay was calculated from the dates.
- In the most recent months more requests are still open, so the median and 90th percentile of days are slightly below the real values.
- The satisfaction survey is optional: in the period, fewer than 4% of requests have an answer, weighted toward people who were dissatisfied.
- The requester profile fields are more than 80% empty and were left out.
- The dataset includes the states and municipalities that joined Fala.BR, not every public body in the country.
Links
- Published dashboardThe dashboard is in Portuguese
- Code on GitHubWith the steps to reproduce every figure, in Portuguese
- CGU, open ombudsman data (in Portuguese)
Independent dashboard, not affiliated with CGU. The data belongs to CGU. The D3 library uses the ISC license.